.jpg)

Acquiring new customers is becoming more expensive, making repeat purchases one of the most reliable ways for Shopify merchants to grow profitably. However, improving customer retention isn't just about launching loyalty programs or sending more email campaigns. Without tracking the right customer retention KPIs, it's difficult to understand why customers return, where they drop off, and which retention strategies actually drive long-term revenue.
Customer retention metrics provide the insights needed to measure customer behavior, evaluate the success of retention efforts, and identify opportunities to improve customer lifetime value. Instead of relying on assumptions, merchants can use these KPIs to make informed decisions that strengthen loyalty, reduce churn, and increase repeat purchases.
In this guide, you'll learn the customer retention KPIs every Shopify merchant should monitor, how to measure and interpret them, common mistakes to avoid, and practical ways to use retention analytics to build a more profitable ecommerce business. You'll also see how Kefi Commerce helps merchants improve these metrics through personalized loyalty programs, promotions, and customer engagement strategies.
As customer acquisition costs continue to rise, retention metrics have become one of the most important indicators of sustainable ecommerce growth. Customer retention KPIs help Shopify merchants understand whether they're building long-term customer relationships or relying too heavily on acquiring new shoppers.
Customer retention KPIs are the metrics that show how well your ecommerce store keeps customers coming back. They measure repeat purchases, loyalty, customer satisfaction, and long-term customer value, helping you evaluate whether your retention strategies are delivering measurable business results.
Tracking these KPIs helps you identify what's working, uncover retention gaps early, and make data-driven decisions that increase repeat revenue while reducing dependence on costly customer acquisition.
Customer retention KPIs measure how well you keep existing customers, while customer acquisition metrics measure how effectively you attract new ones. Both are essential for ecommerce growth, but they focus on different stages of the customer journey.
Retention and acquisition are not competing priorities. They complement each other. Customer acquisition brings new shoppers to your store, while retention helps maximize their long-term value through repeat purchases and stronger customer loyalty.
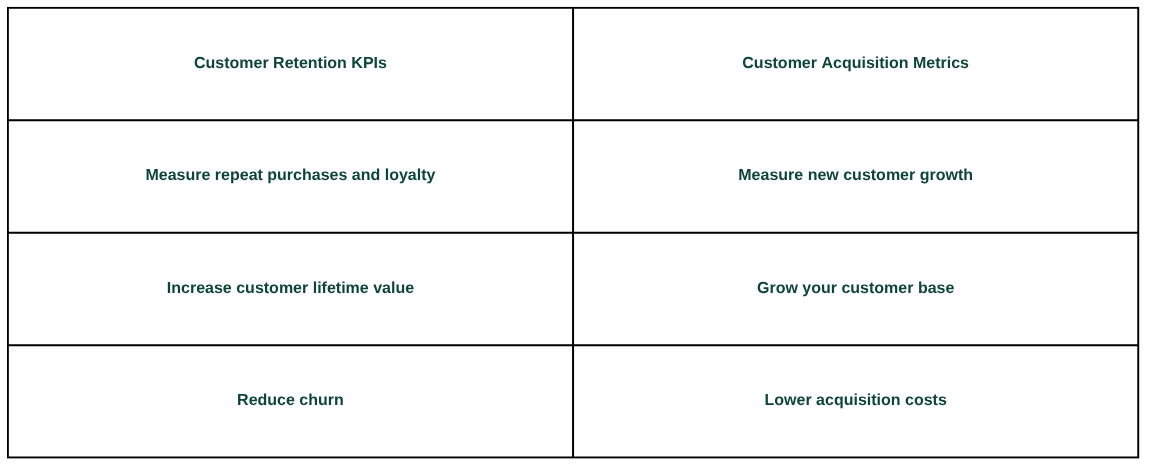
Merchant insight: The strongest Shopify stores balance both strategies by attracting new customers while continuously improving retention to drive sustainable revenue growth.
Retention metrics show whether your existing customers, or active users, continue to generate revenue over time. When shoppers make repeat purchases, your business earns more from the same customer without constantly increasing acquisition spend.
Metrics like customer lifetime value (CLV), repeat purchase rate, and customer churn rate reveal whether your retention strategies are working. Improving these KPIs often leads to higher profitability, stronger customer relationships, and more predictable revenue growth.
Rather than relying solely on acquiring new customers, successful ecommerce brands use retention metrics to build sustainable, long-term growth.
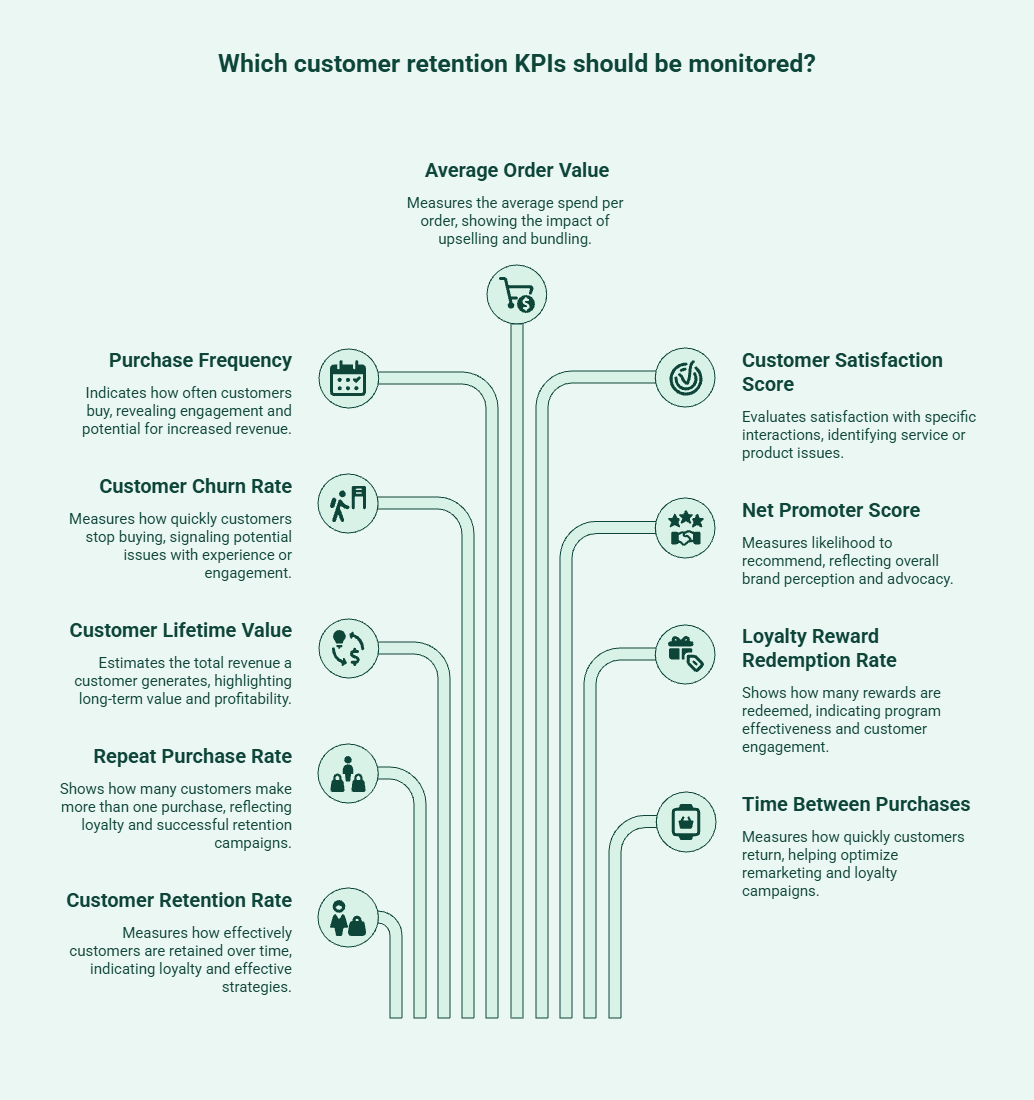
Not every retention metric deserves equal attention. The most valuable customer retention KPIs show whether shoppers return, spend more over time, and stay engaged with your brand. Together, these metrics help you measure customer loyalty, identify retention gaps, and make informed decisions that drive repeat revenue.
Customer Retention Rate (CRR) measures the percentage of customers who continue shopping with your store over a specific period. It is one of the most important customer retention KPIs because it shows whether your products, customer experience, and retention strategies are encouraging repeat purchases.
Formula:
Customer Retention Rate = ((Customers at End of Period − New Customers) ÷ Customers at Start of Period) × 100
To calculate CRR, select a reporting period, subtract the new customers acquired during that time from your ending customer count, divide the result by the number of customers at the beginning of the period, and multiply by 100.
Why it matters
Merchant insight: A consistently improving customer retention rate indicates that customers find enough value to return, reducing reliance on costly customer acquisition and supporting sustainable ecommerce growth.
Example
If your store started the month with 1,000 customers, ended with 1,150 customers, and 250 were new customers, your Customer Retention Rate would be:
((1,150 − 250) ÷ 1,000) × 100 = 90%
This means 90% of your existing customers continued shopping with your business during that period, indicating strong customer loyalty and effective retention strategies.
Repeat Purchase Rate (RPR) measures the percentage of customers who make more than one purchase within a specific period. It is one of the most valuable customer retention KPIs, including the customer rate, because it shows how effectively your store turns first-time buyers into loyal customers.
Formula:
Repeat Purchase Rate = (Customers with More Than One Purchase ÷ Total Customers) × 100
A rising RPR indicates that your products, customer experience, and post-purchase strategies are encouraging shoppers to return, which in turn can affect the overall product return rate. A declining rate may signal friction after the first purchase or a lack of compelling reasons to buy again.
Why it matters
Merchant insight: If your Repeat Purchase Rate is low, consider improving post-purchase communication, personalized offers, or loyalty rewards to give customers a stronger reason to return.
Example
If 320 out of 1,000 customers placed more than one order during a quarter, your Repeat Purchase Rate would be:
(320 ÷ 1,000) × 100 = 32%
This means 32% of your customers returned to make another purchase, indicating how effectively your store converts first-time buyers into repeat customers.
Customer Lifetime Value (CLV) estimates the total revenue a customer is expected to generate throughout their relationship with your store. It shows the long-term value of every customer, making it easier to measure the financial impact of your retention efforts and customer acquisition cost.
Formula:
Customer Lifetime Value = Average Order Value × Purchase Frequency × Average Customer Lifespan
A growing CLV indicates that customers are buying more often, spending more per order, or staying loyal for longer. Together, these behaviors contribute to sustainable revenue growth and stronger profitability.
Why it matters
Merchant insight: Improving CLV isn't just about increasing order values. Encouraging customers to buy more frequently and stay engaged over time often has a greater impact on long-term revenue.
Example
If your Average Order Value is $75, customers purchase 4 times per year, and the average customer lifespan is 3 years, your Customer Lifetime Value would be:
$75 × 4 × 3 = $900
This means each customer is expected to generate $900 in revenue over their relationship with your store, helping you determine how much you can invest in retention and customer acquisition while remaining profitable.
Customer Churn Rate measures the percentage of customers who stop buying from your store over a specific period. It helps you understand how quickly customers leave and whether your retention strategies are keeping them engaged.
Formula:
Customer Churn Rate = (Customers Lost During the Period ÷ Customers at the Start of the Period) × 100
A lower churn rate indicates that customers continue returning to your store, while a higher rate often signals issues with the customer experience, product satisfaction, or post-purchase engagement over a given time frame.
Why it matters
Merchant insight: If churn starts increasing, review where customers drop off. Improving onboarding, post-purchase communication, loyalty rewards, or personalized offers can often reduce churn and strengthen long-term retention.
Example
If your store starts the month with 1,000 customers and 50 customers stop purchasing, your Customer Churn Rate is:
(50 ÷ 1,000) × 100 = 5%
A 5% churn rate means one in every twenty customers stopped buying during that period, giving you an early signal to investigate and improve your retention strategy.
Purchase Frequency measures how often customers place orders within a specific period. It helps Shopify merchants understand buying patterns and whether existing customers continue engaging with their store.
Formula:
Purchase Frequency = Total Number of Purchases ÷ Total Number of Customers
A higher purchase frequency indicates that customers are shopping more often, which typically contributes to higher customer lifetime value and stronger retention.
Why it matters
Merchant insight: If purchase frequency starts to decline, review your reorder reminders, loyalty rewards, personalized recommendations, and promotional campaigns. Small improvements that encourage customers to place one more order can significantly increase long-term revenue.
Example
If your store receives 2,400 orders from 800 customers in a quarter:
Purchase Frequency = 2,400 ÷ 800 = 3
This means each customer placed an average of three orders during the quarter, indicating strong customer engagement and healthy repeat purchasing behavior.
Average Order Value (AOV) measures the average amount customers spend per order. Although AOV is primarily a revenue metric, it becomes an important retention KPI because loyal customers often spend more per order over time. it shows whether your existing customers are spending more each time they shop, making it an important KPI for long-term revenue growth.
Formula:
Average Order Value = Total Revenue ÷ Total Number of Orders
A growing AOV often indicates that customers are adding more items to their carts or responding well to bundles, upsells, and personalized offers.
Why it matters
Merchant insight: If your Average Order Value AOV is low, encourage customers to spend more per order with product bundles, volume discounts, personalized recommendations, or free shipping thresholds instead of relying on deeper discounts.
Example
If your Shopify store generates $60,000 from 1,200 orders in a month:
Average Order Value = $60,000 ÷ 1,200 = $50
This means customers spend an average of $50 per order, giving you a benchmark to measure the impact of promotions, upsells, and bundling campaigns over time.
Customer Satisfaction Score (CSAT) measures how satisfied customers are with a specific experience, such as placing an order, receiving a delivery, or interacting with customer support. Unlike NPS, which reflects long-term loyalty, CSAT helps you evaluate the quality of individual touchpoints across the customer journey.
Formula:
Customer Satisfaction Score = (Number of Positive Responses ÷ Total Responses) × 100
A high CSAT shows customers are consistently having positive experiences, while lower scores highlight operational issues that need immediate attention before they affect future purchases.
Why it matters
Merchant insight: Use CSAT to pinpoint friction at individual touchpoints, such as checkout, shipping, or customer support. Improving these experiences creates a smoother buying journey and increases the likelihood that customers will return.
Example
If 180 out of 200 customers rate their purchase or support experience positively:
Customer Satisfaction Score = (180 ÷ 200) × 100 = 90%
A 90% CSAT indicates that customers are satisfied with specific interactions, giving you confidence that key parts of the shopping experience are meeting expectations.
Net Promoter Score (NPS) measures how likely customers are to recommend your Shopify store to others. Unlike CSAT, which evaluates a specific interaction, NPS reflects a customer's overall perception of your brand and their willingness to advocate for it over time.
Formula:
Net Promoter Score = % of Promoters − % of Detractors
Customers answer one question on a scale of 0 to 10: "How likely are you to recommend our store to a friend or colleague?" Customers who score 9–10 are Promoters, 7–8 are Passives, and 0–6 are Detractors.
Why it matters
Merchant insight: A strong NPS shows that customers trust your brand enough to recommend it to others. While repeat purchases drive revenue, customer advocacy helps attract new shoppers through referrals and positive word-of-mouth.
Example
If 65% of respondents are Promoters, 20% are Passives, and 15% are Detractors:
Net Promoter Score = 65 − 15 = 50
An NPS of 50 indicates strong customer advocacy, suggesting many customers are willing to recommend your Shopify store based on their overall experience with your brand.
Loyalty Reward Redemption Rate measures the percentage of rewards customers actually redeem. It shows whether your loyalty program motivates customers to engage, return, and make additional purchases.
Formula:
Loyalty Reward Redemption Rate = (Rewards Redeemed ÷ Rewards Issued) × 100
A high redemption rate indicates that your rewards are relevant and easy to use, while a low rate may suggest customers don't see enough value in your offers or face barriers to redeeming them.
Why it matters
Merchant insight: If redemption rates are low, simplify the redemption process, personalize rewards, or offer incentives customers genuinely value. An engaging loyalty program encourages customers to return more often and increases customer lifetime value.
Example
If your store issues 1,000 rewards and customers redeem 650 of them:
Loyalty Reward Redemption Rate = (650 ÷ 1,000) × 100 = 65%
A 65% redemption rate suggests your loyalty program is actively engaging customers and supporting repeat purchases, making it a valuable indicator of long-term retention success.
Time Between Purchases measures the average time customers take to place another order after buying from your store. It helps you understand purchasing patterns and whether your retention strategies are encouraging customers to return sooner.
Formula:
Time Between Purchases = Total Time Between Repeat Orders ÷ Number of Repeat Purchases
A shorter time between purchases often indicates stronger customer engagement, while longer gaps may signal the need for better post-purchase communication or loyalty incentives.
Why it matters
Merchant insight: Use this KPI to schedule campaigns around your customers' typical reorder window. For example, a coffee subscription brand might send reorder reminders after 30 days, while a furniture retailer may re-engage customers after 9–12 months, depending on buying patterns.
Example
If 100 repeat customers collectively take 3,000 days between their purchases:
Time Between Purchases = 3,000 ÷ 100 = 30 days
This means customers place another order every 30 days on average, giving you a clear benchmark for scheduling reorder reminders, loyalty rewards, or personalized offers before purchase activity begins to decline.
No single KPI tells the complete story. Customer retention KPIs work together to show how customer behavior influences loyalty, repeat purchases, and long-term revenue. Looking at these metrics together helps Shopify merchants identify growth opportunities and make more informed business decisions.
Customer Retention Rate, Repeat Purchase Rate, and Customer Lifetime Value (CLV) are closely connected. As more customers continue buying from your store, repeat purchases increase, leading to higher customer lifetime value and more sustainable revenue growth.
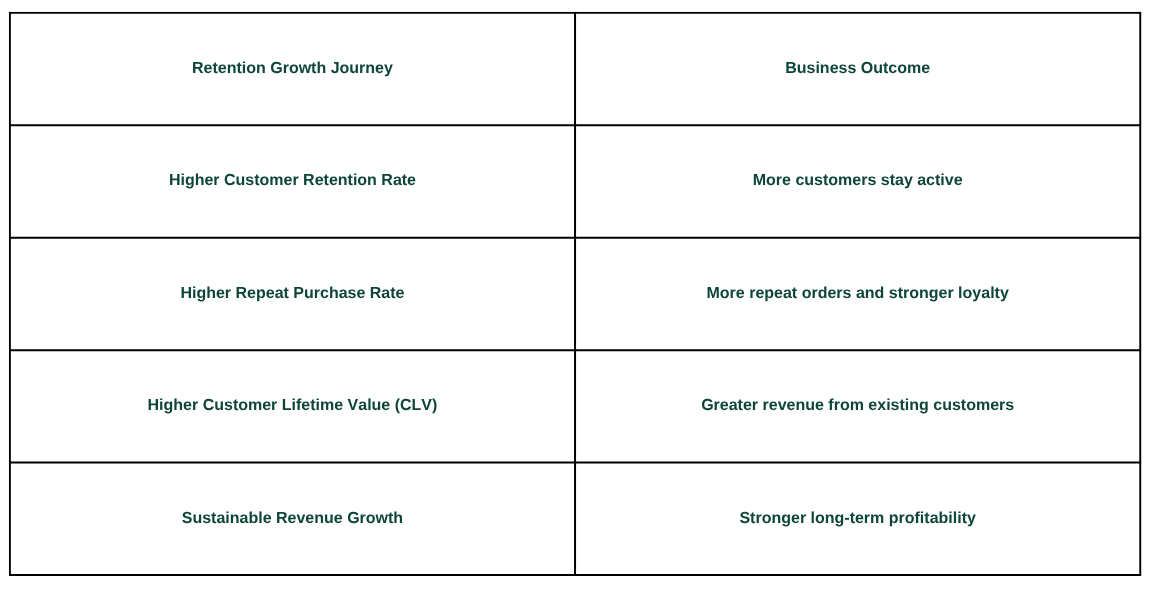
Merchant insight: Rather than improving each KPI independently, focus on how they influence one another. Even a small increase in customer retention can lead to more repeat purchases, higher customer lifetime value, and stronger long-term revenue.
Looking at KPI trends over time helps you spot retention issues before they affect revenue. Instead of reacting to one-off results, monitor how multiple metrics change together to identify opportunities for improvement.
Watch for trends like:
Merchant insight: Review your retention KPIs regularly instead of in isolation. Monitoring trends across multiple metrics helps you make proactive decisions that strengthen customer loyalty and drive sustainable revenue growth.
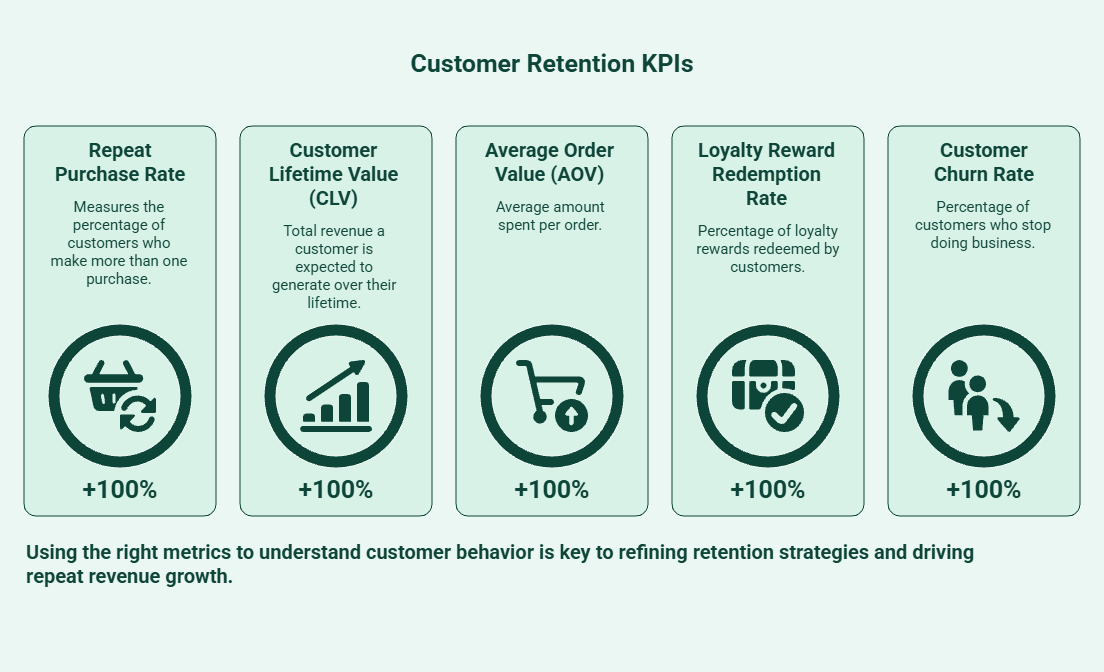
Customer retention KPIs become valuable when they guide action. By analyzing customer behavior and retention trends, you can identify what's driving repeat purchases, where customers disengage, and which strategies deliver the greatest impact.
Not all customers contribute equally to your business. Use metrics like Customer Lifetime Value (CLV), Repeat Purchase Rate, and Average Order Value (AOV) to identify your most valuable customer segments.
Why it matters
Best practice: Create separate campaigns for your highest-value customers instead of using the same retention strategy for everyone.
Customer retention metrics help you tailor rewards based on shopping behavior instead of offering the same incentives to every customer.
Why it matters
Watch for: If reward redemption remains low, simplify your rewards or personalize offers based on purchase frequency and order value.
The customer journey doesn't end after checkout. Monitor Repeat Purchase Rate and Time Between Purchases to understand whether your follow-up emails, support, and loyalty campaigns encourage customers to return.
Quick win
Small improvements to your post-purchase experience can encourage customers to return sooner and buy more often.
Retention campaigns should evolve as customer behavior changes. Review your KPIs consistently to identify which promotions, loyalty initiatives, and engagement strategies generate measurable improvements.
Measure campaign success by tracking:
Compare campaign performance over time to identify which retention initiatives consistently deliver the best results.
Use changes in Customer Churn Rate, Customer Satisfaction Score, and Time Between Purchases to identify customers who may be losing interest before they stop buying.
Early warning signs
Identifying these trends early gives you more opportunities to re-engage customers before they're lost.
Improving customer retention isn't about tracking more KPIs. It's about using the right metrics to understand customer behavior, refine your retention strategy, and create more opportunities for repeat revenue growth.
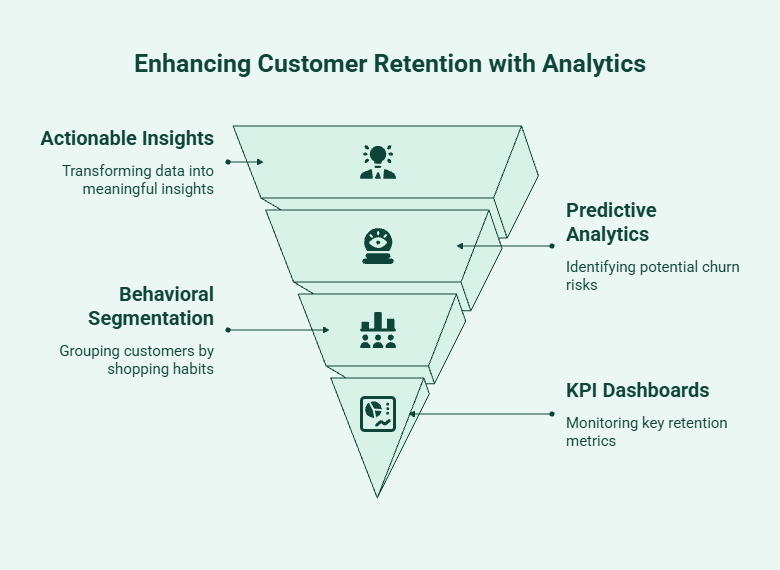
Customer retention analytics turn raw customer data into actionable insights. Instead of only tracking KPIs, they help you understand customer behavior, identify retention opportunities, and make informed decisions that improve loyalty and long-term revenue.
Retention analytics become valuable when they connect customer behavior with business outcomes.
Use retention data to:
Best practice: Combine transactional data with customer feedback to understand not just what customers do, but why they do it.
AI-powered analytics help merchants identify customers who are most likely to stop buying before churn affects revenue. Instead of reacting after customers leave, predictive models highlight early warning signs so you can intervene sooner.
AI can help you:
Merchant insight: Acting on predictive insights early often improves retention more effectively than reacting after customers become inactive.
Behavioral segmentation groups customers based on how they shop instead of relying only on demographics. This helps merchants deliver more relevant offers and improve customer engagement.
Segment customers by:
Best practice: Personalize rewards and campaigns for each customer segment rather than sending the same message to your entire customer base.
A well-designed dashboard keeps your most important retention metrics in one place, making it easier to monitor performance and respond quickly.
Include metrics such as:
Dashboard tips
By combining KPI trends, predictive analytics, and behavioral insights, Shopify merchants can make faster, data-driven decisions that improve customer retention and repeat revenue.
Tracking customer retention KPIs is only valuable if the data leads to better decisions. Avoid these common mistakes to get more meaningful insights from your retention metrics.
Common mistakes to avoid
Focus on a small set of high-impact KPIs and review them consistently. Clear, reliable metrics make it easier to identify retention opportunities and take action before customer loyalty declines.
Successful retention strategies are driven by data, not assumptions. Instead of reacting after customer loyalty declines, successful Shopify merchants use customer retention KPIs to identify issues early and choose the right action.
Turn KPI insights into action
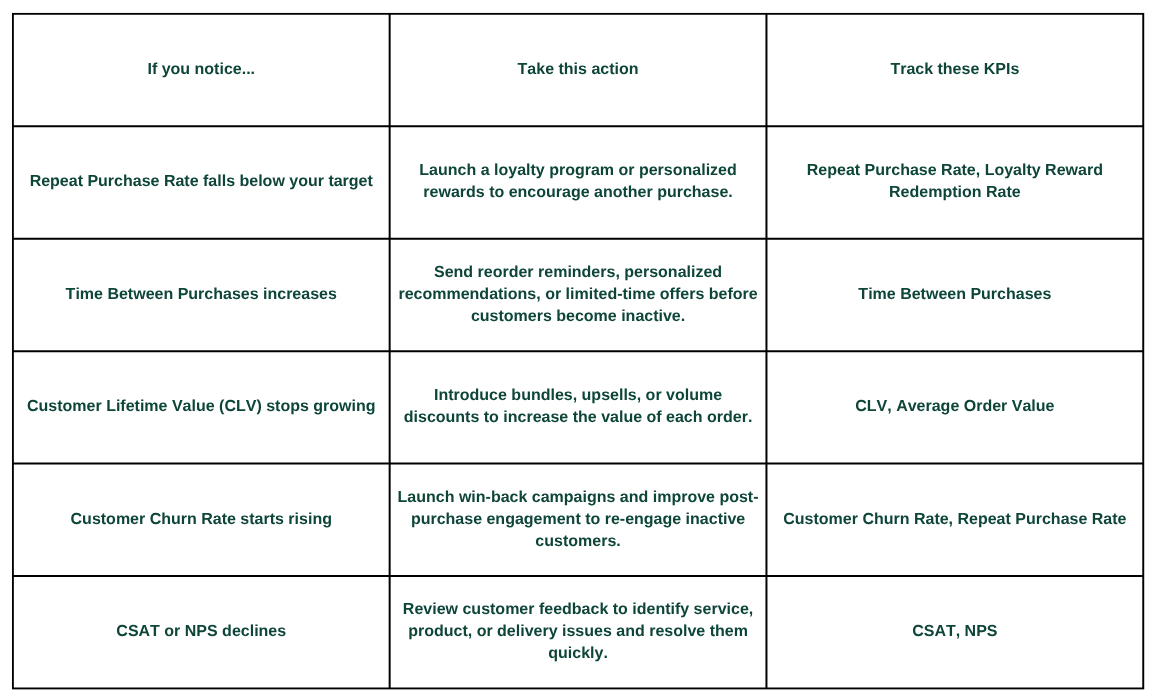
Customer retention KPIs deliver the greatest value when they guide timely action. The right tools and strategies help you respond faster, strengthen customer loyalty, and turn retention insights into measurable business growth.
Improving customer retention KPIs requires more than tracking data. Merchants also need the right tools to increase repeat purchases, strengthen customer loyalty, and encourage higher customer lifetime value. Kefi Commerce helps Shopify stores turn retention insights into measurable business growth with loyalty programs, personalized promotions, product bundles, and targeted customer engagement.
With Kefi Commerce, merchants can:
Instead of relying on disconnected tools, Kefi Commerce brings retention strategies and customer engagement together in one platform, helping Shopify merchants build stronger customer relationships and drive sustainable repeat revenue.
Customer retention KPIs do more than measure performance. They help you understand customer behavior, identify opportunities to improve loyalty, and make informed decisions that drive repeat revenue. By focusing on the metrics that matter most and reviewing them consistently, you can build stronger customer relationships and create more sustainable ecommerce growth, positively impacting your bottom line.
If you're looking to turn retention insights into measurable results, Kefi Commerce helps Shopify merchants improve customer retention with loyalty programs, personalized promotions, bundles, and engagement strategies designed to increase repeat purchases and customer lifetime value. Start tracking the right KPIs today and use those insights to build a more profitable, customer-focused business.
Customer Retention Rate (CRR) is often the best KPI for small Shopify businesses because it shows how well you keep existing customers. Pair it with Repeat Purchase Rate and monitor revenue churn rate to understand customer loyalty and identify opportunities to increase repeat revenue.
Review your customer retention KPIs monthly to monitor trends and identify issues early. During major campaigns or seasonal sales, check them weekly to measure performance and make timely adjustments to your retention strategy.
Customer retention metrics measure different aspects of customer behavior, such as repeat purchases, churn, and customer satisfaction. A high retention rate is an important aspect of customer retention KPIs, which are the most important metrics you prioritize to evaluate retention performance and guide business decisions.
SaaS companies focus on subscription-based KPIs like customer churn, renewal rate, and monthly recurring revenue (MRR) to enhance their existing customer base. Ecommerce businesses, including Shopify stores, prioritize repeat purchase rate, customer lifetime value, and average order value to measure customer loyalty and long-term revenue growth.
Improve customer retention by acting on the KPIs that need attention. For example, use loyalty rewards to increase Repeat Purchase Rate, personalize offers to grow Customer Lifetime Value, and strengthen post-purchase engagement if Customer Churn Rate or Time Between Purchases starts to rise.
.svg)
