.png)

Let's take a closer look.
If your store generated more revenue this month than last month, do you know what actually caused the increase? More orders, larger orders, or a combination of both can all drive growth, but each tells a different story about how your business is performing. According to the Harvard Business Review, improving customer retention by just 5% can increase profits by 25% to 95%, highlighting why understanding the drivers behind revenue matters as much as the revenue itself.
That's where GMV and AOV come in. Gross Merchandise Value (GMV) measures the total value of products sold, while Average Order Value (AOV) shows how much customers spend per transaction. Both are revenue metrics, but they answer different questions. One helps you understand sales volume and growth. The other reveals customer spending behaviour and the effectiveness of your offers.
For Shopify merchants, knowing the difference matters. Focusing solely on GMV can mask profitability challenges, while relying solely on AOV can overlook broader growth trends. In this guide, we'll compare GMV vs AOV, explain how each metric is calculated, explore when to prioritise one over the other, and show how they work together to support sustainable ecommerce growth.
Average order value (AOV) tells you how much revenue each order generates on average. If two stores have the same monthly revenue, the one with a higher AOV usually needs fewer orders to reach it. That's why many ecommerce brands treat AOV as a key indicator of sales efficiency rather than just another reporting metric.
AOV is calculated by dividing total revenue by the number of orders placed during a specific period. For example, a store that generates $40,000 from 500 orders has an AOV of $80. While the calculation is simple, the insights behind the number can reveal whether shoppers are buying single products or building larger carts.
For Shopify merchants, AOV helps measure the effectiveness of merchandising and promotional strategies. An increase in AOV often signals that bundles, upsells, cross-sells, or free shipping thresholds are encouraging customers to spend more before checkout. Unlike GMV, which measures total sales value, AOV focuses on the value of each transaction and the quality of revenue generated from existing customers.
A store can increase sales even if customers spend the same amount per order. That's because growth doesn't always come from larger carts. Sometimes it comes from selling more products, attracting more buyers, or increasing order volume. GMV helps merchants measure that broader growth.
Gross Merchandise Value (GMV), sometimes called Gross Merchandise Volume, represents the total value of goods sold during a specific period before deductions such as returns, discounts, refunds, or marketplace fees. For example, if a store sells 100 shirts at $20 and 50 hoodies at $45, its GMV would be $4,250.
For e-commerce businesses, GMV is often used to evaluate sales momentum and overall business scale. A rising GMV can signal stronger demand, successful marketing campaigns, or increased order volume. Unlike AOV, which focuses on the value of each transaction, GMV focuses on the total value of products sold, making it useful for measuring overall growth rather than customer spending behaviour.
No. GMV and revenue are not the same. GMV measures the total value of products sold before deductions, while revenue reflects what the business actually earns after discounts, returns, refunds, and other costs are applied.
This distinction matters because GMV can make performance appear stronger than it is. A store may generate $100,000 in GMV during a month, but actual revenue could be significantly lower after deductions. While GMV is useful for understanding sales activity and growth, revenue provides a more accurate picture of financial performance.
GMV and AOV measure revenue from different perspectives. GMV represents the total value of products sold over a specific period, while AOV is the average amount customers spend per order. One measures the overall sales scale. The other measures the value of individual transactions.
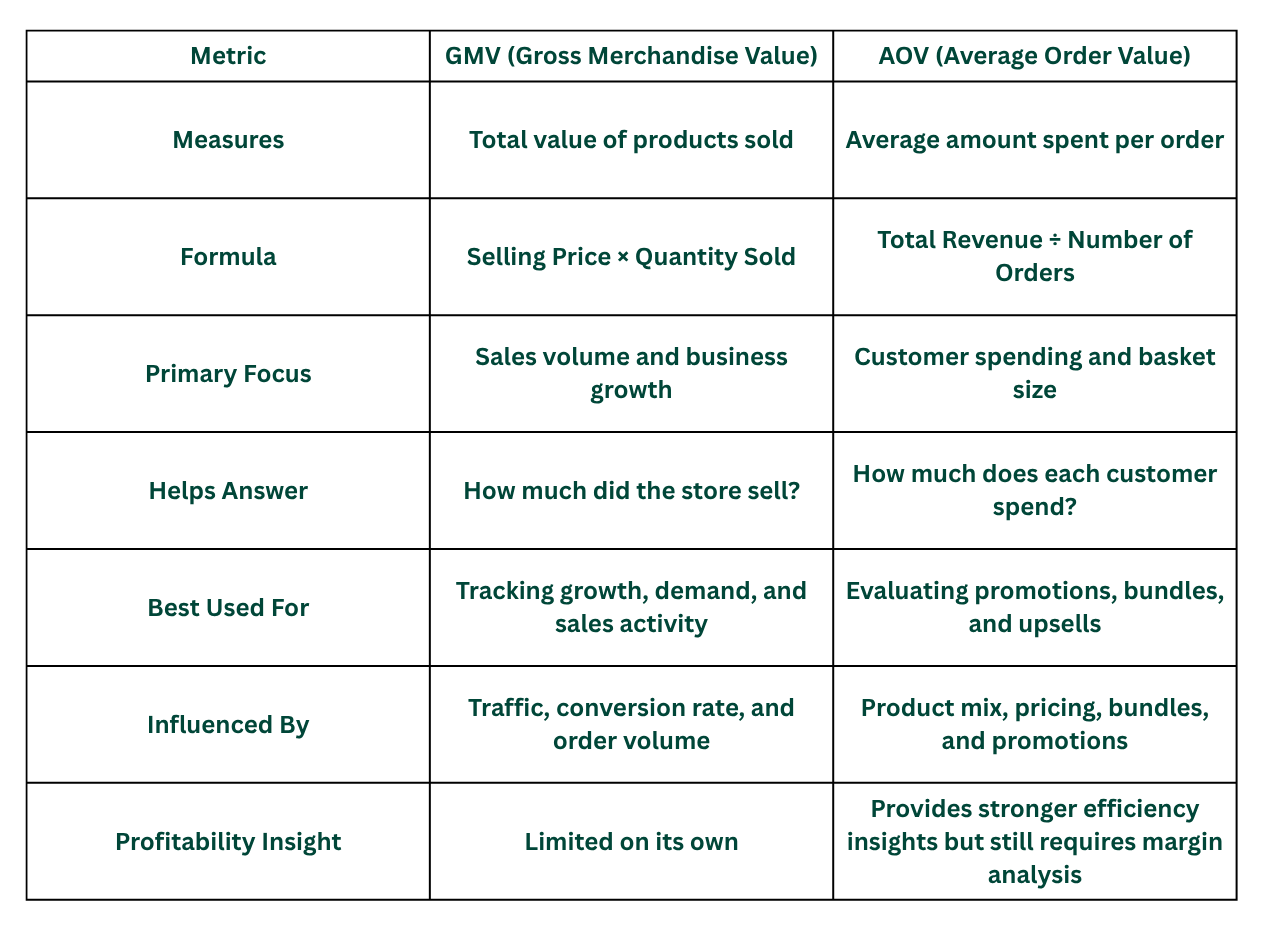
If you're trying to understand overall business growth, GMV is usually the better metric. If you're looking to increase revenue from existing customers, AOV often provides more actionable insights.
Understanding the difference helps merchants identify what's actually driving growth. A store can increase GMV by generating more orders, even if customers spend the same amount per purchase. Likewise, AOV can rise through bundles, upsells, or pricing strategies without a significant increase in total order volume. Focusing on a single metric can obscure important trends in customer behaviour and business performance.
For Shopify merchants, GMV is useful for tracking overall growth, while AOV helps evaluate merchandising, promotions, and customer spending patterns. Together, they provide a more complete picture of store performance than either metric can offer on its own.
Both GMV and AOV are easy to calculate, which is one reason they are widely used by e-commerce teams. The formulas take only a few data points, but the insights they provide can influence decisions around pricing, promotions, customer acquisition, and revenue growth.
GMV measures the total value of products sold before deductions such as returns, refunds, discounts, or marketplace fees. To calculate it, multiply the selling price of each product by the quantity sold, then add the totals together.
Merchants often use GMV to monitor sales trends, compare performance across periods, and understand how changes in traffic, conversion rate, or product demand affect overall sales volume.
AOV measures how much customers spend per transaction on average. It is calculated by dividing total revenue by the number of orders placed during a specific period.
Because AOV focuses on spending behaviour, merchants often use it to evaluate the impact of bundles, upsells, cross-sells, and free shipping thresholds.
Imagine a Shopify store generates $60,000 in sales during a month from 750 orders. The store's GMV would be $60,000. If those sales came from 750 completed purchases, the AOV would be $80.
While the formula focuses on selling price and quantity sold, GMV is influenced by several factors across the ecommerce funnel. More impressions can generate additional clicks; higher click-through rates (CTR) can drive more traffic; stronger conversion rates can create more orders; and higher average order values can increase the value of each transaction. Together, these metrics play a key role in determining overall GMV growth.
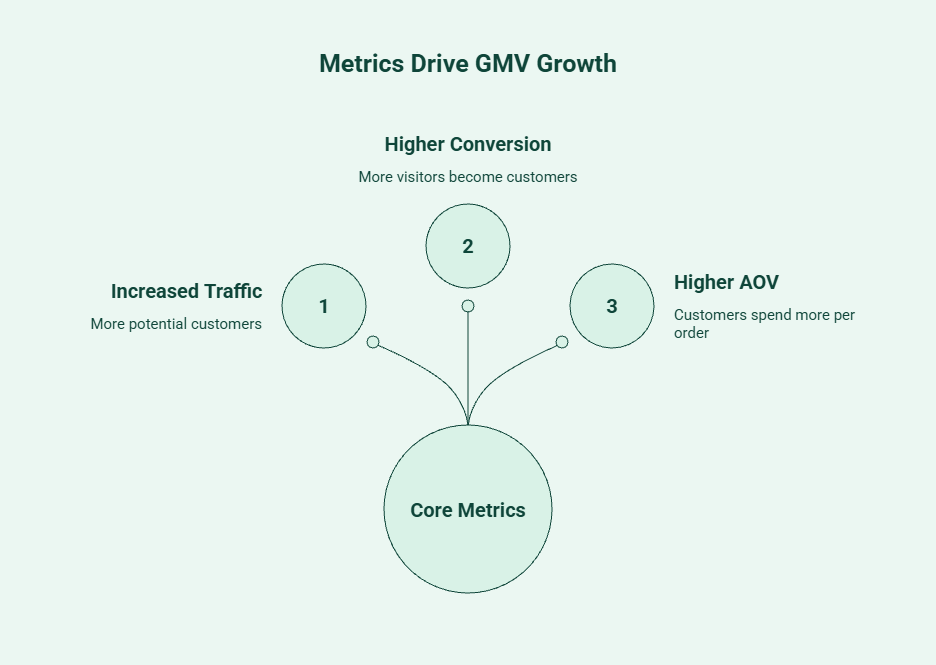
GMV is influenced by three core ecommerce metrics: traffic, conversion rate, and average order value. Understanding how they work together can help merchants identify what's actually driving growth.
Together, these metrics shape GMV. A store can increase GMV by attracting more visitors, converting a higher percentage of traffic, increasing order value, or improving all three at the same time.
For example, a store with 10,000 monthly visitors, a 2% conversion rate, and an $80 AOV will generate significantly less GMV than a store with the same traffic but a 3% conversion rate or a $100 AOV. Looking at these metrics together helps merchants identify where the biggest growth opportunities exist.
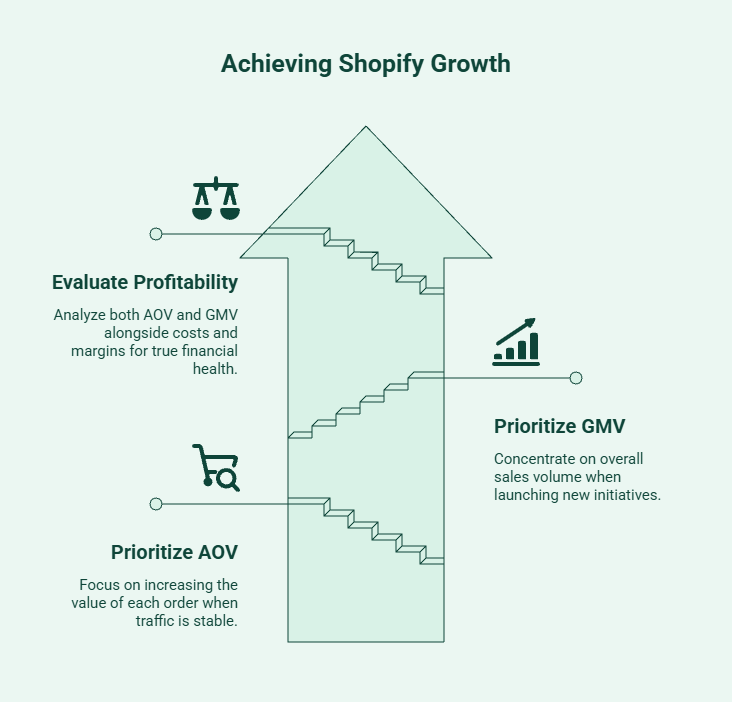
Most Shopify merchants shouldn't choose between GMV and AOV. They should decide which metric deserves more attention based on the problem they're trying to solve. A store struggling with rising acquisition costs needs different insights than a store focused on increasing sales volume or expanding into new channels.
AOV becomes more important when traffic is already coming in, but revenue growth has slowed. In this situation, increasing the value of each order is often faster and more cost-effective than acquiring additional visitors. Merchants commonly focus on AOV when testing bundles, upsells, cross-sells, premium product options, or free shipping thresholds.
AOV is also useful when evaluating marketing efficiency. If customer acquisition costs are increasing, increasing revenue per transaction can improve overall profitability without requiring more traffic.
GMV deserves more attention when the goal is measuring overall business growth. Merchants launching new sales channels, expanding product catalogues, entering new markets, or running large promotional campaigns often use GMV to understand whether total sales activity is increasing.
Because GMV reflects the total value of products sold, it can also help identify demand trends, support inventory planning, and provide a broader view of business performance over time.
Profitability depends on more than either metric alone can show. GMV measures sales volume, while AOV measures spending per order. Neither accounts for fulfilment costs, discounts, returns, advertising expenses, or margins.
That said, AOV often has a more direct influence on efficiency. Larger orders can improve the return on acquisition and fulfilment costs, allowing merchants to generate more revenue from existing customers. To understand true profitability, however, both metrics should be evaluated alongside margins and net revenue.
For example:

Although Store A generated more GMV, Store B would be more profitable because it keeps a larger share of every sale. This is why merchants should avoid using GMV alone to evaluate business performance. Kefi Commerce can help merchants increase AOV through promotions, bundles, loyalty programs, and other revenue growth strategies that support sustainable profitability.
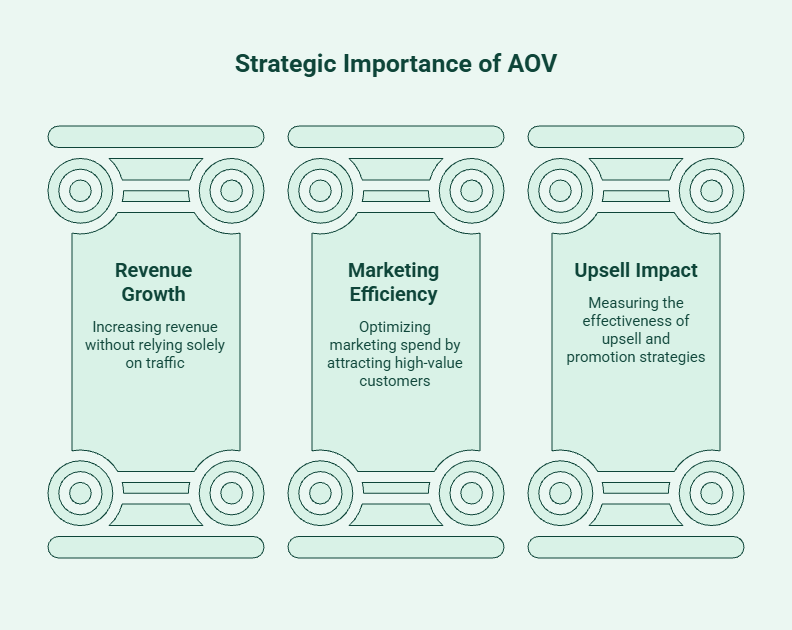
Average order value is a critical growth metric because it helps you increase revenue without depending only on more traffic. When customers spend more in each transaction, your store earns more from the same audience. That can improve efficiency across your marketing strategies.
It also gives you a direct read on customer behaviour. Are shoppers responding to bundles, premium options, or free shipping offers? If yes, AOV usually moves first. That makes it one of the clearest signals for practical e-commerce growth.
One of the strongest reasons to track average order value is simple: you can grow total revenue without attracting more visitors. If your e-commerce store raises AOV from $80 to $90 and traffic stays the same, revenue goes up anyway. That improves marketing efficiency because you earn more from the traffic you already paid for.
This matters when acquisition costs are rising, or your channels are already working well. Instead of pushing harder for more clicks, you improve what happens after people arrive. That is often a smarter move for an established store.
AOV also helps you evaluate channel quality. If one channel brings customers who spend more, it may deserve more budget even if the traffic volume is lower. That is how AOV supports a stronger growth trajectory.
Marketing efficiency improves when you know which campaigns attract the most valuable buyers, not just the most buyers. AOV helps merchants identify channels, audiences, and offers that generate higher-value orders rather than simply increasing traffic.
This insight becomes even more useful when combined with performance metrics such as Return on Ad Spend (ROAS), Marketing Efficiency Ratio (MER), and Revenue Per Visitor (RPV). A campaign with a lower volume of orders may still deliver better results if customers consistently spend more per purchase.
By looking at AOV together with these KPIs, merchants can make more informed decisions about where to invest marketing budgets and which campaigns are driving profitable growth.
AOV is one of the clearest ways to measure whether your revenue growth strategies are working. When customers spend more per order after you introduce bundles, upsells, free gifts, volume discounts, or loyalty incentives, it's often a sign that those initiatives are influencing purchase behaviour.
Promotions require closer analysis. While some offers can increase conversions and total sales, they don't always increase order value. That's why merchants should measure how different tactics affect AOV, revenue per visitor, and overall profitability rather than focusing on sales volume alone.
Tracking these initiatives helps merchants understand which offers are driving sustainable growth and which are simply generating short-term sales spikes. Platforms like Kefi Commerce make it easier to launch, measure, and optimize these strategies from a single place.
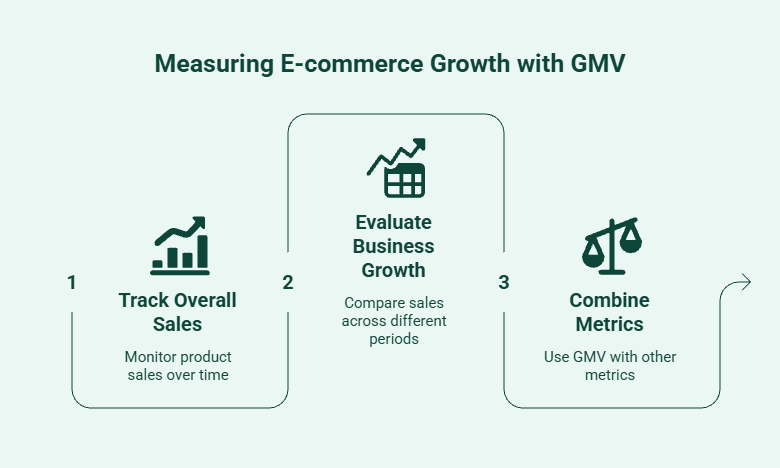
Gross merchandise value is one of the simplest ways to measure e-commerce growth. Because it tracks the total value of products sold before deductions, it provides a high-level view of sales activity across your store.
While GMV doesn't reflect profitability, it can quickly show whether sales volume is increasing, declining, or remaining steady. That's why many e-commerce businesses use it alongside revenue and profitability metrics when evaluating growth.
GMV provides a clear view of how much product your business is selling over a specific period. Tracking it consistently helps merchants compare performance across months, quarters, and promotional campaigns.
Because it captures total sales activity, GMV can help identify demand trends, evaluate channel performance, and monitor overall business momentum.
Growth is easier to understand when you compare sales activity across different periods. GMV helps merchants measure the impact of major campaigns, identify seasonal patterns, and determine whether sales growth is being sustained over time.
Used alongside other performance metrics, it can provide valuable context around how the business is scaling.
GMV is useful for measuring sales activity, but it doesn't provide a complete picture of business performance. Merchants should remember that:
Whether your goal is to increase order value, grow overall sales, or improve customer retention, tracking GMV and AOV together provides a clearer picture of store performance. For merchants looking to turn those insights into action, Kefi Commerce helps combine promotions, bundles, upsells, and loyalty programs into a single platform to support sustainable revenue growth.
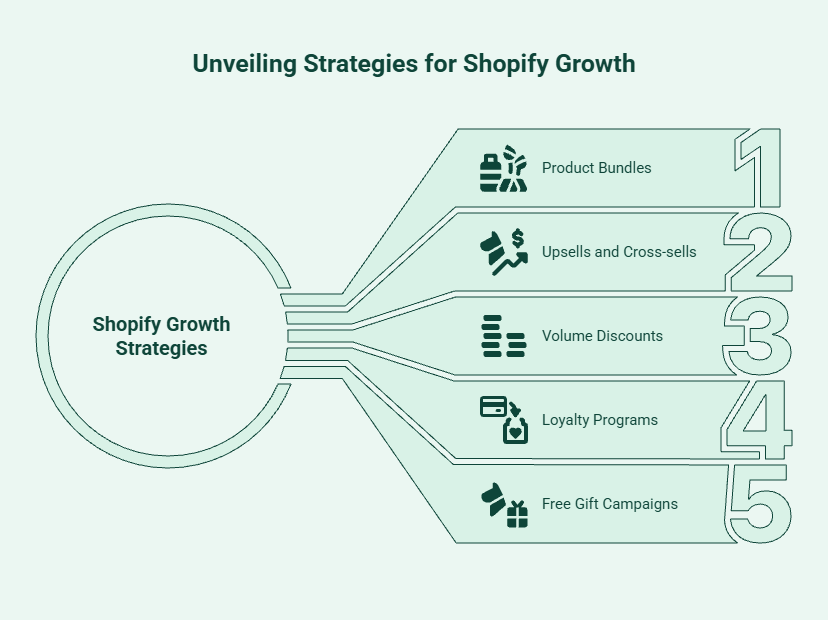
Increasing GMV and AOV often comes down to encouraging customers to buy more products, spend more per order, or return more frequently. The most effective strategies do all three while improving the overall shopping experience.
Product Bundles encourage customers to purchase complementary products together, increasing basket size and total units sold. They also simplify buying decisions by packaging relevant products into a single offer.
Upsells encourage shoppers to choose higher-value products, while cross-sells introduce relevant add-ons that complement the original purchase.
Quantity-based promotions encourage customers to purchase more units in a single order, making them especially effective for consumable or frequently replenished products.
Returning customers typically spend more and convert faster than first-time buyers. Loyalty programs encourage repeat purchases while creating opportunities to increase customer lifetime value.
Free gift campaigns encourage shoppers to spend more by offering an additional product when they reach a specific cart value or purchase threshold. When structured correctly, they can increase both average order value and total sales volume without relying solely on discounts.
Growing GMV and AOV often requires multiple strategies working together. Bundles can increase basket size, Buy More Save More offers can encourage higher quantities, and loyalty programs can drive repeat purchases. Managing these initiatives separately can become difficult as stores scale.
Kefi Commerce helps Shopify merchants run promotions, loyalty programs, and revenue growth campaigns from a single platform. By making it easier to launch and optimise offers that encourage larger purchases and repeat orders, merchants can increase average order value while supporting long-term GMV growth.
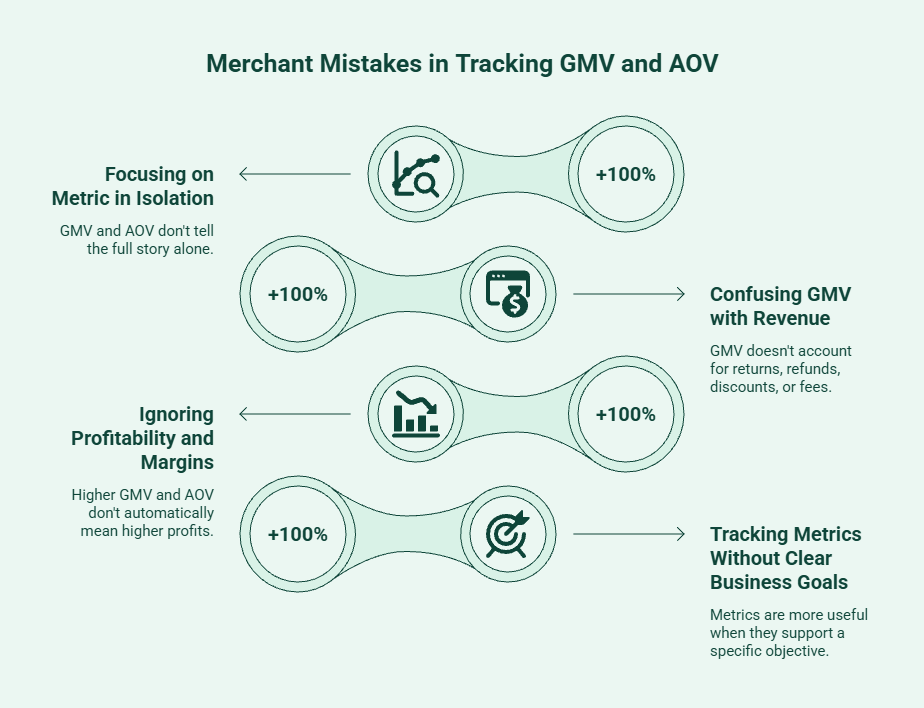
GMV and AOV can provide valuable insights, but only when they're interpreted correctly. Looking at either metric without additional context can lead to misleading conclusions about growth, profitability, and overall business performance.
Neither GMV nor AOV tells the full story on its own. A store can increase GMV while average order value falls, or improve AOV while overall sales volume declines.
Tracking both metrics together helps merchants understand whether growth is coming from more orders, larger orders, or a combination of both.
GMV measures the total value of products sold before deductions. It does not account for returns, refunds, discounts, or fees.
Merchants who treat GMV as revenue may overestimate business performance and make decisions based on inflated numbers rather than actual earnings.
Higher GMV and AOV do not automatically mean higher profits. Aggressive discounting, rising fulfilment costs, or low-margin products can increase sales while reducing profitability.
Growth metrics should always be reviewed alongside margins and net revenue to understand the true impact on the business.
Metrics become far more useful when they support a specific objective. Merchants focused on increasing basket size may prioritise AOV, while those expanding sales volume may pay closer attention to GMV. Before optimising any metric, define the business outcome you're trying to achieve and use the data to measure progress against that goal.
GMV and AOV are most valuable when used together. GMV helps merchants understand overall sales growth, while AOV reveals how effectively each order contributes to revenue. Looking at both metrics provides a clearer view of what's driving performance and where growth opportunities exist.
As your store scales, improving these metrics often comes down to executing the right promotions, bundles, upsells, and retention strategies. Kefi Commerce helps Shopify merchants bring those initiatives together to increase order value, strengthen customer loyalty, and support long-term revenue growth.
GMV provides a clear view of overall sales growth and business scale, making it useful for tracking demand and performance trends. However, it doesn't account for profitability, returns, discounts, or customer spending behavior, which can make growth appear stronger than it is.
GMV and AOV can both support profitability, but neither measures profit directly. GMV shows sales volume, while AOV reflects customer spending per order. Higher AOV often improves efficiency by generating more revenue from each transaction, but margins, costs, and returns ultimately determine profitability.
There are no universal GMV or AOV benchmarks for U.S. ecommerce businesses because both metrics vary widely by industry, product type, pricing strategy, and customer behavior. Merchants should compare performance against their historical data and industry peers rather than relying on a single benchmark.
GMV and AOV measure e-commerce growth from different angles. GMV shows whether total sales volume is increasing, while AOV reveals whether customers are spending more per order. Tracking both helps merchants understand whether growth is coming from more purchases, larger purchases, or a combination of both.
Merchants can increase GMV without raising AOV by attracting more traffic, improving conversion rates, expanding product catalogs, entering new sales channels, or increasing repeat purchases. These strategies grow total sales volume while keeping average order values relatively unchanged.
.svg)
