

Acquiring new customers is important, but the real key to sustainable growth lies in keeping the ones you already have. Focusing on your customer retention rate is a powerful strategy for building a profitable business. By tracking key metrics, you can understand how to increase customer lifetime value and strengthen your retention efforts. This allows you to pinpoint friction in the customer journey and optimize your strategies for long-term loyalty, turning satisfied buyers into your most valuable brand advocates.
Customer retention metrics are key performance indicators that measure how effectively your business keeps its customers over time. These quantifiable measurements provide direct insight into customer loyalty and engagement, helping you understand how well your products and services meet expectations. By monitoring these figures, you can quantify the success of your retention strategy and make data-backed decisions to improve it. Core metrics include your customer retention rate, which shows the percentage of customers who stay, and your customer churn rate, which tracks the percentage who leave.
Effectively using these metrics allows you to understand customer behavior more deeply. For instance, the repeat purchase rate indicates how many customers return to make another purchase, a strong signal of satisfaction. Analyzing these numbers helps you refine the customer experience, identify at-risk customers before they leave, and optimize your efforts to build long-term relationships. Ultimately, these metrics are the foundation for a successful retention strategy that drives sustainable growth.
For B2B companies, the best customer retention metric is often the retention rate, which measures the percentage of clients a business retains over a set period. This metric is particularly valuable in B2B contexts where long-term contracts and ongoing relationships are key to growth and stability.
Tracking customer retention metrics provides a clear view of your business's health and its relationship with customers. A high customer retention rate is a direct indicator of customer satisfaction and loyalty, signaling that your products and retention strategy are resonating with your audience. This focus is far more cost-effective than constantly acquiring new customers. Furthermore, monitoring these metrics allows you to identify trends and address potential issues proactively.
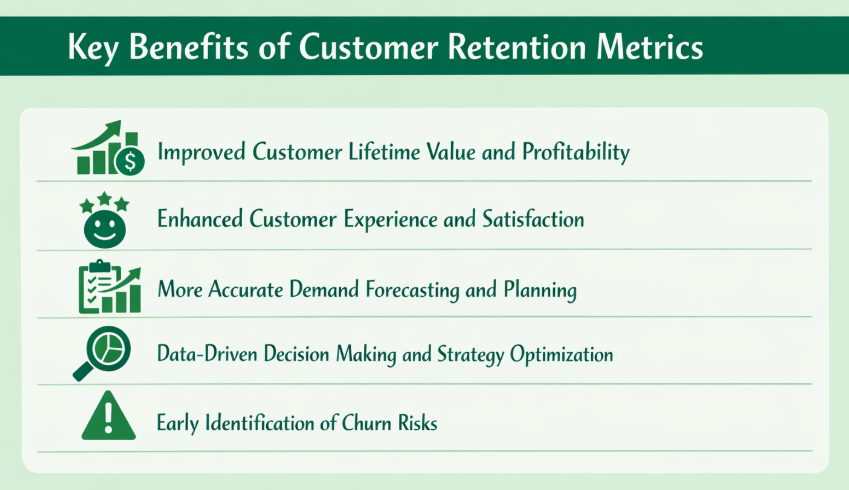
One of the most significant benefits of tracking retention is the direct impact on customer lifetime value (CLV) and overall profitability. CLV measures the total net profit a customer generates throughout their entire relationship with your brand. By focusing on retention, you increase the average customer lifespan, which naturally boosts their lifetime value.
Loyal customers are the engine of sustainable revenue growth. They tend to spend more over time than new customers; research indicates existing customers spend 67% more on average. A small 5% increase in customer retention can lead to a 25% or more increase in profit.
This focus on retaining your most valuable buyers ensures that your marketing spend is more efficient. Instead of pouring all your resources into acquisition, you can invest in strategies that nurture existing relationships, leading to higher profitability and a more resilient business model.
Retention metrics act as a report card for your customer experience. Metrics like the Customer Satisfaction Score (CSAT) and Net Promoter Score (NPS) provide direct feedback from customers about their interactions with your brand. A low score can be an early warning sign of friction or dissatisfaction, allowing you to address issues before they lead to churn.
By analyzing this feedback, you can pinpoint specific pain points in the customer journey. Is your checkout process confusing? Is your customer support slow? These metrics help you uncover and fix these problems, leading to a smoother, more enjoyable experience for your buyers.
Ultimately, this data empowers you to make targeted improvements. Whether it's refining your product, improving support, or implementing loyalty programs, these efforts show customers you value their business. This commitment to a better customer experience is what builds lasting satisfaction and loyalty.
Understanding your retention metrics is crucial for accurate demand forecasting. When you know key figures like your average time between purchases and repeat purchase rate, you can predict future sales with much greater confidence. This knowledge moves you from guesswork to data-driven planning.
For instance, if you know your average customer makes a repeat purchase every 45 days and has an average order value of $37, you can create a more reliable revenue forecast. This insight helps you set realistic KPIs for revenue growth and manage inventory more effectively, avoiding stockouts and overstocking.
This level of predictability is invaluable for strategic planning. It allows your business to allocate resources more efficiently, plan marketing campaigns around expected purchase cycles, and make smarter decisions about everything from staffing to product development.
Customer retention metrics replace assumptions with facts. Instead of guessing what your customers want, you can use data analytics to understand their behavior and preferences. This empowers you to make informed decisions that directly impact your bottom line and drive strategy optimization.
By tracking key metrics, you can measure the effectiveness of your retention efforts in real-time. For example, you can test a new email campaign or a personalized recommendation engine and see its direct impact on repeat purchase rates or customer lifetime value.
This continuous feedback loop allows you to refine and optimize your strategies over time. You can identify which channels, products, and campaigns are most effective at retaining customers and allocate your resources accordingly, ensuring your retention efforts yield the highest possible return.
A rising customer churn rate is a clear warning sign that something is wrong. By monitoring your churn rate and related metrics, you can identify at-risk customers and intervene before they leave for good. This proactive approach is essential for maintaining a healthy customer base.
Metrics such as a drop in purchase frequency, declining engagement, or a low Net Promoter Score can signal potential churn. For instance, a customer who used to purchase monthly but hasn't made a purchase in three months is a clear churn risk. Analyzing these trends helps you understand the root causes of customer attrition.
With these early warnings, you can take targeted action. You might send a personalized re-engagement email, offer a special discount, or reach out with a customer feedback survey. Addressing the issues that lead to high churn is far more effective than trying to win back customers after they've already left.
Also Read: How Calitron Boosted Revenue and AOV with Smart Bundling.
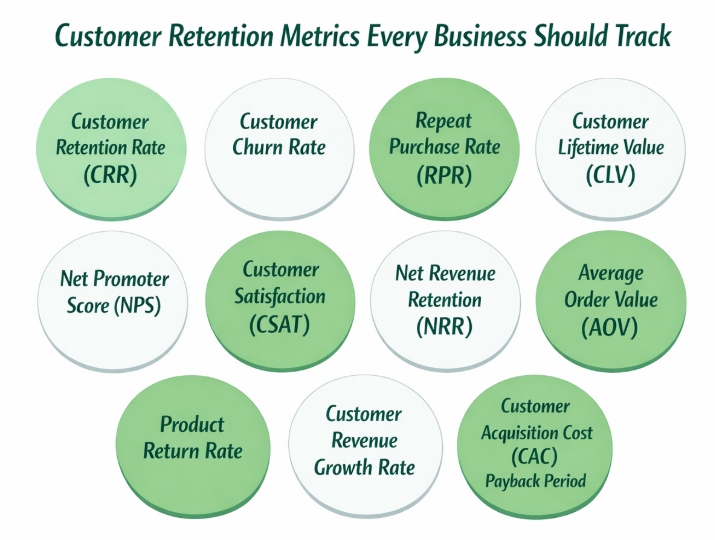
To build a successful retention strategy, you need to track the right data. The most important customer retention metrics provide a comprehensive view of customer loyalty, satisfaction, and profitability. These key metrics act as your guide, showing you what’s working and where you need to improve. Tracking these indicators will help you make smarter, data-driven decisions to boost loyalty.
Your Customer Retention Rate (CRR) is a fundamental measure of how well you keep customers over a specific time period. It calculates the percentage of existing customers who remain loyal to your brand, excluding any new customers acquired during that period. A high CRR is a strong indicator of customer satisfaction and a sustainable business model.
This metric is crucial because retained customers are more profitable. They help lower your overall customer acquisition costs and provide a predictable revenue stream. For ecommerce companies, an average CRR is around 38%, so exceeding this benchmark is a sign of a healthy business.
To calculate your CRR, you need three pieces of data: the number of total customers at the start of the period (S), the number of customers at the end of the period (E), and the number of new customers acquired during that period (N). The formula is: CRR = [ (E - N) / S ] x 100.
Customer Churn Rate is the direct opposite of your retention rate. It measures the percentage of customers who stop doing business with you over a specific period. This metric is a critical health indicator, as a high churn rate can signal problems with your product, pricing, or customer experience.
Understanding why customers churn is key. Voluntary churn occurs when a customer actively decides to leave, while involuntary churn occurs due to issues such as a failed payment. By focusing on voluntary churn, you can identify and address the root causes of dissatisfaction within your control.
To calculate your churn rate, you need the number of customers at the start of the period, the number at the end of the period, and the number of new customers acquired. For example, if you start a month with 100 customers, end with 105, and acquired 10 new ones, it means you lost 5 customers. Your churn rate for that period would be 5%.
The Repeat Purchase Rate (RPR) measures the percentage of your customer base that has made more than one purchase from you within a given timeframe. This metric is a powerful indicator of customer loyalty and satisfaction with their initial purchase. Unlike CRR, this calculation typically includes new customers.
A high RPR indicates that you are successfully encouraging customers to return. These loyal customers are invaluable because you have more data on their preferences, enabling more effective personalization, cross-sells, and recommendations. For most ecommerce businesses, a healthy repeat purchase rate ranges from 20% to 40%.
Calculating your RPR is straightforward. Simply divide the number of customers who made a repeat purchase during a period by the total number of customers during that same period, then multiply by 100. If 20 out of 50 customers made a second purchase in a month, your RPR would be 40%.
Customer Lifetime Value (CLV) is a predictive metric that estimates the total net profit you will earn from a single customer over the course of their relationship with your brand. It’s one of the most important metrics for understanding long-term profitability and identifying your most valuable customer segments.
A strong CLV indicates that you are not only acquiring customers but also retaining them and maximizing the revenue they generate over time. As a general rule, a good customer lifetime value is typically at least three times your customer acquisition cost. This ratio ensures your acquisition efforts are profitable.
To calculate CLV, you need to know your average order value (AOV), your repeat purchase rate, and the average customer lifespan. First, find your average customer value by multiplying AOV by the purchase rate. Then, multiply that number by the average customer lifespan to determine the total lifetime value.
The Net Promoter Score (NPS) is a widely used metric that measures customer loyalty and the likelihood they will recommend your brand to others. It’s based on a single, powerful question: "On a scale of 0-10, how likely are you to recommend our company/product/service to a friend or colleague?"
Based on their responses, customers are categorized into three groups. Promoters (9-10) are your loyal enthusiasts, Passives (7-8) are satisfied but unenthusiastic, and Detractors (0-6) are unhappy customers who can damage your brand. Your NPS score provides a clear, quantitative measure of overall customer sentiment and engagement.
The final score is calculated by subtracting the percentage of Detractors from the percentage of Promoters. The resulting number, ranging from -100 to 100, serves as an early warning system for customer satisfaction issues and helps you identify opportunities to improve customer relationships.
Also Read: How Puur Scaled Average Order Value via Intelligent Accessory Pairing.
The Customer Satisfaction Score (CSAT) is a metric used to measure customer satisfaction with a specific interaction, product, or service. Unlike NPS, which measures overall loyalty, CSAT provides immediate feedback on a particular touchpoint in the customer experience, such as a support ticket resolution or a recent purchase.
Typically, customers are asked to rate their satisfaction on a scale (e.g., 1-5, from "very unsatisfied" to "very satisfied"). This direct feedback is invaluable for identifying and addressing specific pain points in your processes. A low CSAT score after a customer support interaction, for example, points to a clear area for improvement.
By tracking CSAT scores across different parts of the customer journey, you can get a granular understanding of what's working and what isn't. This allows you to make targeted improvements that enhance the overall customer experience and boost long-term satisfaction and retention.
Net Revenue Retention (NRR), also known as revenue churn, is a critical metric, especially for subscription-based businesses. It measures the change in recurring revenue from your existing customer base over a period, accounting for both revenue losses (downgrades, cancellations) and revenue gains (upgrades, cross-sells).
While customer retention rate tracks the number of customers you keep, NRR tracks the total revenue you retain from them. It's possible to have a 100% customer retention rate but a lower NRR if customers downgrade their plans. Conversely, an NRR over 100% indicates that revenue growth from existing customers is outpacing any revenue churn.
Calculating NRR involves taking your starting monthly recurring revenue (MRR), adding expansion revenue from upsells, and subtracting revenue lost to churn and downgrades. This gives you a clear picture of your company's financial health and its ability to grow from its existing customer base.
Average Order Value (AOV) measures the average dollar amount spent each time a customer places an order on your site. While not exclusively a retention metric, it plays a key role in maximizing the value you get from repeat customers and is a crucial component of calculating Customer Lifetime Value (CLV).
An increasing AOV suggests that your strategies for upselling and cross-selling are effective. Customers are finding more products they like, giving them more reasons to be satisfied and return in the future. This boosts total revenue without requiring additional ad spend to acquire new customers.
To calculate your AOV, simply divide your total revenue by the total number of orders placed during the same period. For example, if you generated $10,000 in sales from 100 orders, your AOV would be $100. Improving this metric is a powerful lever for profitability.
The Product Return Rate is the percentage of items sold that customers return. While returns are an unavoidable part of ecommerce, a high return rate can signal significant problems with product quality, inaccurate descriptions, or a poor customer experience.
Monitoring this rate helps you identify issues that hurt customer satisfaction and impact your repeat purchase rate. For example, if a specific item has a consistently high return rate, it may be time to review its product page for clarity or investigate potential quality control issues. The average ecommerce return rate was 16.5% in 2022.
However, a return isn't always a negative event. A simple and hassle-free return process can actually build trust. Over 90% of consumers report they would buy from a site with an easy return policy again. To calculate it, divide the number of items returned by the total number of items sold and multiply by 100.
The Existing Customer Revenue Growth Rate measures the year-over-year increase in spending from your current customer base. This metric specifically isolates revenue from existing customers, showing how effectively you are increasing their customer value over time through upsells, cross-sells, and other engagement strategies.
This growth rate is a powerful indicator of successful retention and customer engagement. It proves that your existing customers are finding more value in your offerings and are willing to spend more with your brand. A positive growth rate here is a sign of a healthy, growing business.
To calculate this metric, you compare the monthly recurring revenue (MRR) from existing customers between two periods. The formula is: (Current Month MRR - Previous Month MRR) / Previous Month MRR * 100. This calculation excludes revenue from new customers, giving you a pure view of growth from your loyal base.
The Customer Acquisition Cost (CAC) Payback Period is the time it takes for your business to recoup the cost of acquiring a new customer. This metric connects your acquisition costs directly to customer value and retention, providing a clear measure of marketing efficiency and long-term profitability.
A shorter payback period is ideal, as it means you become profitable on a new customer more quickly. This allows you to reinvest that capital in growth initiatives more quickly. Strong retention efforts that increase customer lifetime value are essential for shortening this period.
To calculate the payback period, you divide your CAC by the average revenue per customer per month (or another chosen time frame). If your CAC is $150 and a customer generates $50 in profit per month, your payback period is three months. Improving retention is one of the most effective ways to accelerate this timeline.
Also Read: How to Master Revenue Optimization for Your Business?
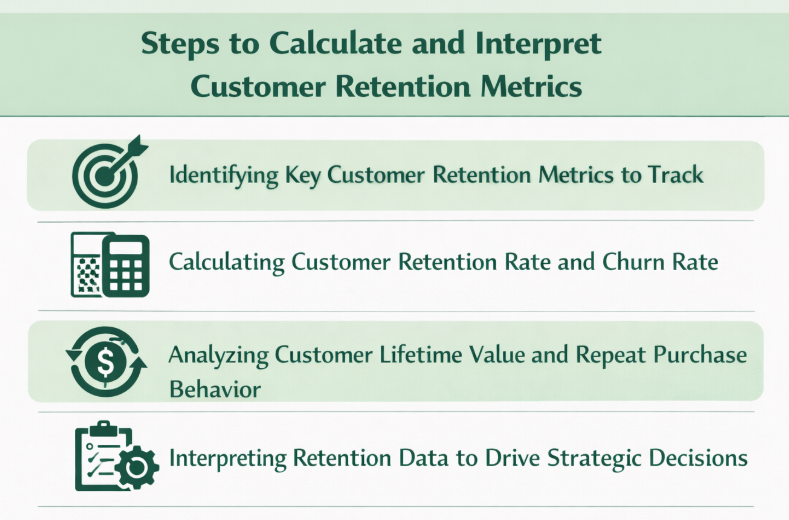
Calculating and interpreting customer retention metrics is a systematic process. It starts with identifying the right metrics for your business model, then applying clear formulas to derive the data you need. The calculation of the customer retention rate, for example, requires knowing the number of customers at the start and end of a period, as well as the number of new customers acquired. This analysis turns raw numbers into actionable insights that can guide your retention strategy.
The first step in measuring customer retention is to decide which key metrics matter most to your business. While there are many metrics available, your focus should align with your specific business model and goals. A SaaS company will prioritize different metrics than an ecommerce store.
Start by defining what success looks like for you. Is it reducing monthly churn, increasing repeat purchases, or boosting the lifetime value of your customer base? Your goals will determine which KPIs are most relevant. It's also wise to analyze these metrics across different customer segments to uncover deeper insights.
To prioritize, consider focusing on a mix of metrics that provide a holistic view of customer health. Some of the most universally important metrics to start with include:
Calculating customer retention rate and churn rate provides a clear understanding of how well your business retains existing customers over a specific period. These two metrics are closely connected: churn represents the customers you lose, while retention reflects those you keep. To calculate them accurately, you need three key data points: the number of customers at the start of the period (S), the number at the end of the period (E), and the number of new customers acquired during that same timeframe (N).
The retention rate formula focuses only on existing customers by subtracting new customers from the ending total and comparing the result to the starting total, giving you the percentage of customers who stayed. On the other hand, the churn rate is calculated as the proportion of customers lost during that period, determined by comparing the initial customer base with the retained portion.
Using a consistent timeframe, such as monthly or quarterly, ensures more reliable tracking and helps businesses identify trends, measure loyalty, and make informed decisions to improve customer retention.
Analyzing Customer Lifetime Value (CLV) and repeat purchase behavior moves beyond simple retention numbers to measure profitability. CLV predicts the total revenue an average customer will generate, while the repeat purchase rate indicates how frequently they return to make purchases. Together, they paint a detailed picture of customer loyalty and value.
Start by calculating the average purchase value and the average number of purchases for your repeat customers. This helps you understand the typical spending habits of your loyal base. Do they buy small items frequently or large items infrequently? This customer behavior insight is crucial for forecasting.
By segmenting your customers, you can identify which groups have the highest CLV. Are customers acquired through a specific channel more valuable? Do buyers of a certain product tend to become long-term repeat customers? Answering these questions allows you to focus your marketing and retention efforts where they will have the greatest impact.
Collecting retention data is only half the battle; the real value comes from interpreting it to make smarter strategic decisions. Your data analytics should tell a story about your customer relationships. A drop in your retention rate, for instance, isn't just a number, it's a signal that something in the customer experience needs attention.
When you analyze retention data, look for trends and correlations. Does a dip in your Net Promoter Score precede a spike in churn? Does a campaign promoting free shipping lead to a higher repeat purchase rate? Connecting these dots helps you understand the cause-and-effect relationships within your business.
Use these insights to refine your retention strategy. If you discover that customers who engage with your loyalty program have a 50% higher lifetime value, you know to invest more in promoting it. This data-driven approach ensures your efforts focus on initiatives that demonstrably improve customer loyalty and profitability.
Also Read: How Lifetime Technologies went from a Single Additive to System Kits.
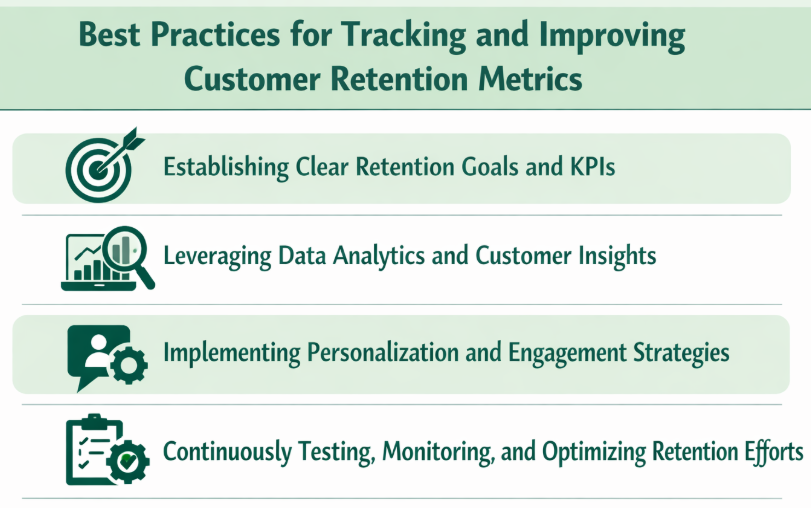
Improving your customer retention metrics requires a strategic and consistent approach. Following best practices ensures that your retention efforts are effective and data-driven. It starts with setting clear goals and using the right tools to track your progress toward them. The key is to move from simply measuring retention metrics to actively using them to enhance the customer experience.
The foundation of any successful retention strategy is a set of clear, measurable goals. Without specific targets, your efforts will lack focus and direction. Start by defining what you want to achieve. Do you want to increase your customer retention rate by 5% over the next quarter or reduce your monthly churn rate below 3%?
Your retention goals should be SMART: Specific, Measurable, Attainable, Relevant, and Time-based. For example, a goal to "improve loyalty" is too vague. A better goal is: "Increase the repeat purchase rate from 25% to 30% by the end of the year by implementing a new loyalty program."
Once you have your goals, align your key metrics (KPIs) to track progress. If your goal is to boost customer lifetime value, your primary KPIs would be average order value and purchase frequency. This alignment ensures that your entire team is working toward the same concrete outcomes.
Data analytics transforms raw numbers into actionable customer insights. To truly understand why customers stay or leave, you need to look beyond surface-level metrics. Use analytics tools to segment your customer base and analyze their behavior at a granular level.
For example, data can reveal that customers who purchase a specific product are twice as likely to churn within 30 days. This insight allows you to investigate the product or the post-purchase experience associated with it. Is the product not meeting expectations? Is the onboarding process confusing?
Combine quantitative data with qualitative feedback from surveys and support tickets to get the full story. This holistic view of customer engagement enables you to make precise, data-driven adjustments to your retention efforts, ensuring you're solving the right problems for the right customers.
Generic, one-size-fits-all marketing is no longer effective. Personalization is key to building strong customer relationships and improving retention. Use the data you've collected to tailor the customer experience to individual preferences and behaviors. This shows customers that you understand and value them.
Effective engagement strategies include personalized product recommendations, targeted email campaigns based on purchase history, and exclusive offers for loyal customers. For instance, if you know a customer's average time between purchases is 60 days, you can send a reminder email with a relevant offer around day 55.
Loyalty programs are another powerful tool for driving engagement. By rewarding customers for their repeat business, you give them a compelling reason to stick with your brand. These personalized and engaging experiences are what differentiate you from competitors and turn one-time buyers into lifelong fans.
Customer retention is not a "set it and forget it" initiative. It requires continuous testing, monitoring, and optimization. Customer preferences and market dynamics are always changing, so your retention efforts must evolve as well.
Regularly review your retention dashboards to track your progress against your goals. If a particular strategy isn't delivering the expected results, don't be afraid to change it. A/B test different email subject lines, personalized offers, and website layouts to see what resonates most with your audience.
Incorporate feedback from all customer-facing teams, especially customer support, as they are on the front lines of customer interaction. This cycle of monitoring, learning, and optimization ensures your retention strategy remains effective and continues to impact your bottom line positively.
Also Read: What are the Essential Ecommerce Optimization Strategies?
Improving your retention metrics often comes down to increasing customer value and satisfaction. This is where tools that enhance the shopping experience can make a significant impact. The Kefi product Bundle Builder is designed to do just that by empowering customers to create their own personalized product bundles. This strategy directly boosts key metrics such as Average Order Value (AOV) by encouraging customers to purchase multiple items in a single transaction.
By giving customers control over their purchase, you create a more engaging and satisfying customer journey. This positive customer experience increases the likelihood that they will become repeat customers. When buyers can easily build a bundle that perfectly suits their needs, their perceived customer value and satisfaction rise, strengthening their connection to your brand. Kefi helps you integrate this powerful retention strategy seamlessly into your ecommerce store, turning one-time purchases into long-term loyalty.
Book a Demo to see how Kefi Product Bundle Builder works.
In conclusion, understanding and tracking essential customer retention metrics is vital for any business seeking to enhance profitability and foster long-term customer relationships. By focusing on metrics such as Customer Lifetime Value, Churn Rate, and Net Promoter Score, you can gain valuable insights that help tailor your retention strategies effectively. Implementing best practices like leveraging data analytics, setting clear KPIs, and continuously optimizing your engagement efforts will not only improve customer satisfaction but also contribute significantly to overall revenue growth. Start prioritizing these metrics today, and watch your business thrive as you meet and exceed customer expectations. For a more in-depth look at how you can implement these strategies, consider reaching out for a free consultation.
Customer retention metrics, such as the customer retention rate, measure your ability to keep existing customers. In contrast, customer acquisition metrics, such as acquisition costs (CAC), focus on the process and expense of attracting new customers. One measures loyalty, while the other measures growth through new business.
A customer retention metric is a specific measurement used to track how successfully a company retains its customers. Businesses use these metrics to evaluate customer satisfaction, monitor engagement, and guide strategies that improve long-term relationships.
Customer retention metrics in ecommerce often include repeat purchase rate, customer lifetime value, and churn rate. These metrics help online retailers understand buying behavior and identify opportunities to encourage repeat purchases.
Some essential customer retention metrics include retention rate, churn rate, repeat purchase rate, and customer lifetime value. Tracking these indicators provides a complete view of how well your business maintains long-term customer relationships.
Customer loyalty and retention metrics measure engagement, repeat purchases, and overall satisfaction. These insights help businesses strengthen customer relationships and develop strategies that foster long-term loyalty.
Key SaaS customer retention metrics include monthly recurring revenue retention, customer churn rate, and net revenue retention. These metrics help SaaS companies evaluate subscription stability and identify growth opportunities.
Onboarding metrics track how effectively new customers adopt and engage with a product early on. Monitoring activation rates, time to first value, and early engagement helps businesses identify improvements that increase long-term retention.
Key customer retention metrics include customer retention rate, churn rate, repeat purchase rate, and customer lifetime value. Together, they provide a comprehensive understanding of customer loyalty and business sustainability.
Metrics such as churn rate, purchase frequency, and customer engagement levels can signal when customers are likely to leave. Monitoring these indicators allows businesses to take proactive steps to improve retention.
To measure customer retention effectively, businesses typically track retention rate, churn rate, repeat purchase rate, and customer lifetime value. These metrics provide insights into customer loyalty and long-term revenue potential.